IPN Analytics & Data Infrastructure
Company-wide analytics infrastructure providing daily insights into member growth, demographics, portal utilization, events, marketing, social media, and website performance and trends.
Overview & Problem Statement
Daily visibility into IPN performance and membership was limited and scattered across systems, with no single source of truth. Since its founding in 2020, membership data lived across Mailchimp, a now-retired IPN app, and Google Forms. As a result, it was difficult to answer basic operating questions: how many members we have, who they are, which are active, and how they engage.
Solution
I built a centralized analytics and data infrastructure to provide trusted day-to-day operating visibility. This included creating a deduped membership file as a single source of truth and a daily cron job that pulls data from seven sources (Supabase, Google Analytics, Instagram, Facebook, Mailchimp, Zoom, and Eventbrite). The data is ingested into a unified data schema stored in Supabase and organized into focused views for membership, portal utilization, events, email, social media, and website performance. This information provides IPN with a way to measure and assess performance, as well as inform improvement initiatives and new program offerings.
Implementation Details
- Mapped KPIs by key business functions/member journeys: As highlighted in our E2E member experience workshop, we mapped key performance indicators to each aspect of the member journey from member acquisition to registration, onboarding, and ongoing member engagement. This ensured all key information about how members hear about, find, register, and engage with IPN is captured.
- Built the membership source-of-truth Excel file: I consolidated historical registration records from Mailchimp, the retired IPN app, and Google Forms. I standardized fields and email addresses, and deduplicated records by email to create one authoritative membership dataset in Excel.
- Designed the Supabase data schema: I separated live portal data, historical membership records, and incoming analytics sources within a unified Supabase data model. I mapped and loaded the cleaned, deduplicated member dataset, creating a consistent foundation for reporting on membership growth, aggregate demographics, geography, professional background, interests, and registration sources.
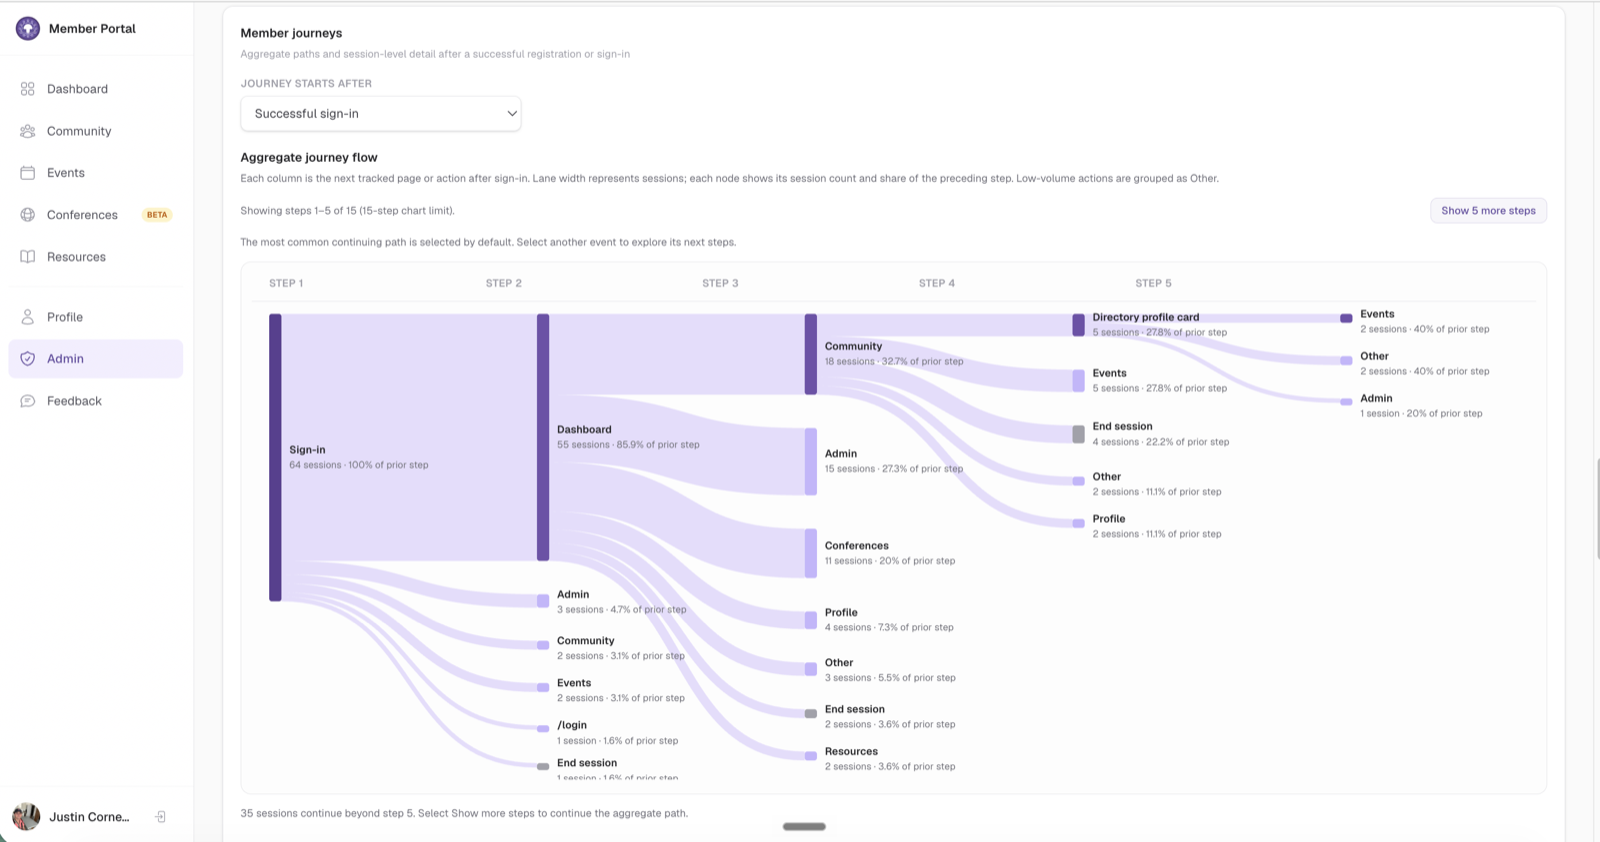
- Instrumented the member portal: I implemented first-party events for registration steps, sign-in, page views, time on page, clicks, errors, event RSVPs, and other event actions. Session-level journeys show what members do after registration or sign-in so that we can track and learn from member behavior.
- Connected external performance data: I integrated Mailchimp, Meta, GA4, Zoom, Eventbrite, and other operating sources through APIs. I kept high-cost sources manual when automation did not justify the cost.
- Designed charts and tables for at-a-glance use: I organized the interface into scannable tabs and designed charts and tables to surface performance, trends, and supporting detail at a glance. I added plain-English definitions, methodology, and refresh cadence so leadership could interpret each view consistently.
- Automated refreshes with guardrails: I moved the pipeline to a daily cloud schedule through GitHub Actions, added source-status checks, and prevented invalid pulls from erroneously replacing trusted data. The system reports freshness and failures daily through a dedicated Slack channel.
Features
- Membership overview: registration growth, source mix, demographics, professional background, interests, and member geography.
- Portal utilization: registration conversion and step-level drop-off, sign-in conversion, monthly active users, device mix, page views, time on page, errors, and session journeys.
- Event performance: registrations, attendance, participation duration, retention, repeat attendees, and event-level detail.
- Email performance: subscriber growth, campaign open and click rates, unsubscribes, and link-level click activity over time.
- Social media performance: follower trends, platform engagement, and post-level likes and comments.
- Website performance: traffic trends, acquisition sources, devices, geography, top pages, and conversion-page behavior.
- Data Sources & Glossary: metric definitions, methodology, source details, refresh cadence, and freshness status.
Outcomes & Impact
- A single source of truth for membership data and insights, providing meaningful visibility into who our members are and informing future programs and offerings. Approximately 22% of duplicate records were removed.
- Eight data sources consolidated into one operating view instead of separate logins and exports, saving leadership time and energy pulling this data manually, without incurring any ongoing costs.
- First-party portal instrumentation now shows registration drop-off, product utilization, return activity, and member journeys, informing ways to improve the user experience.
- Shared definitions and source status give leadership a consistent reference for interpreting the data.
Lessons Learned
- Less is more: There are a million things we can measure, but more data does not create more clarity. Choose the few metrics that show how something is performing and where attention is needed.
- Instrumentation and user journeys to understand user experience: Registration counts tell me that someone joined. Step-level conversion, page duration, journeys, and return activity showed where the experience works and where it creates friction.
Links
- Access: Internal to IPN leadership. No public link.
Gallery